

Main
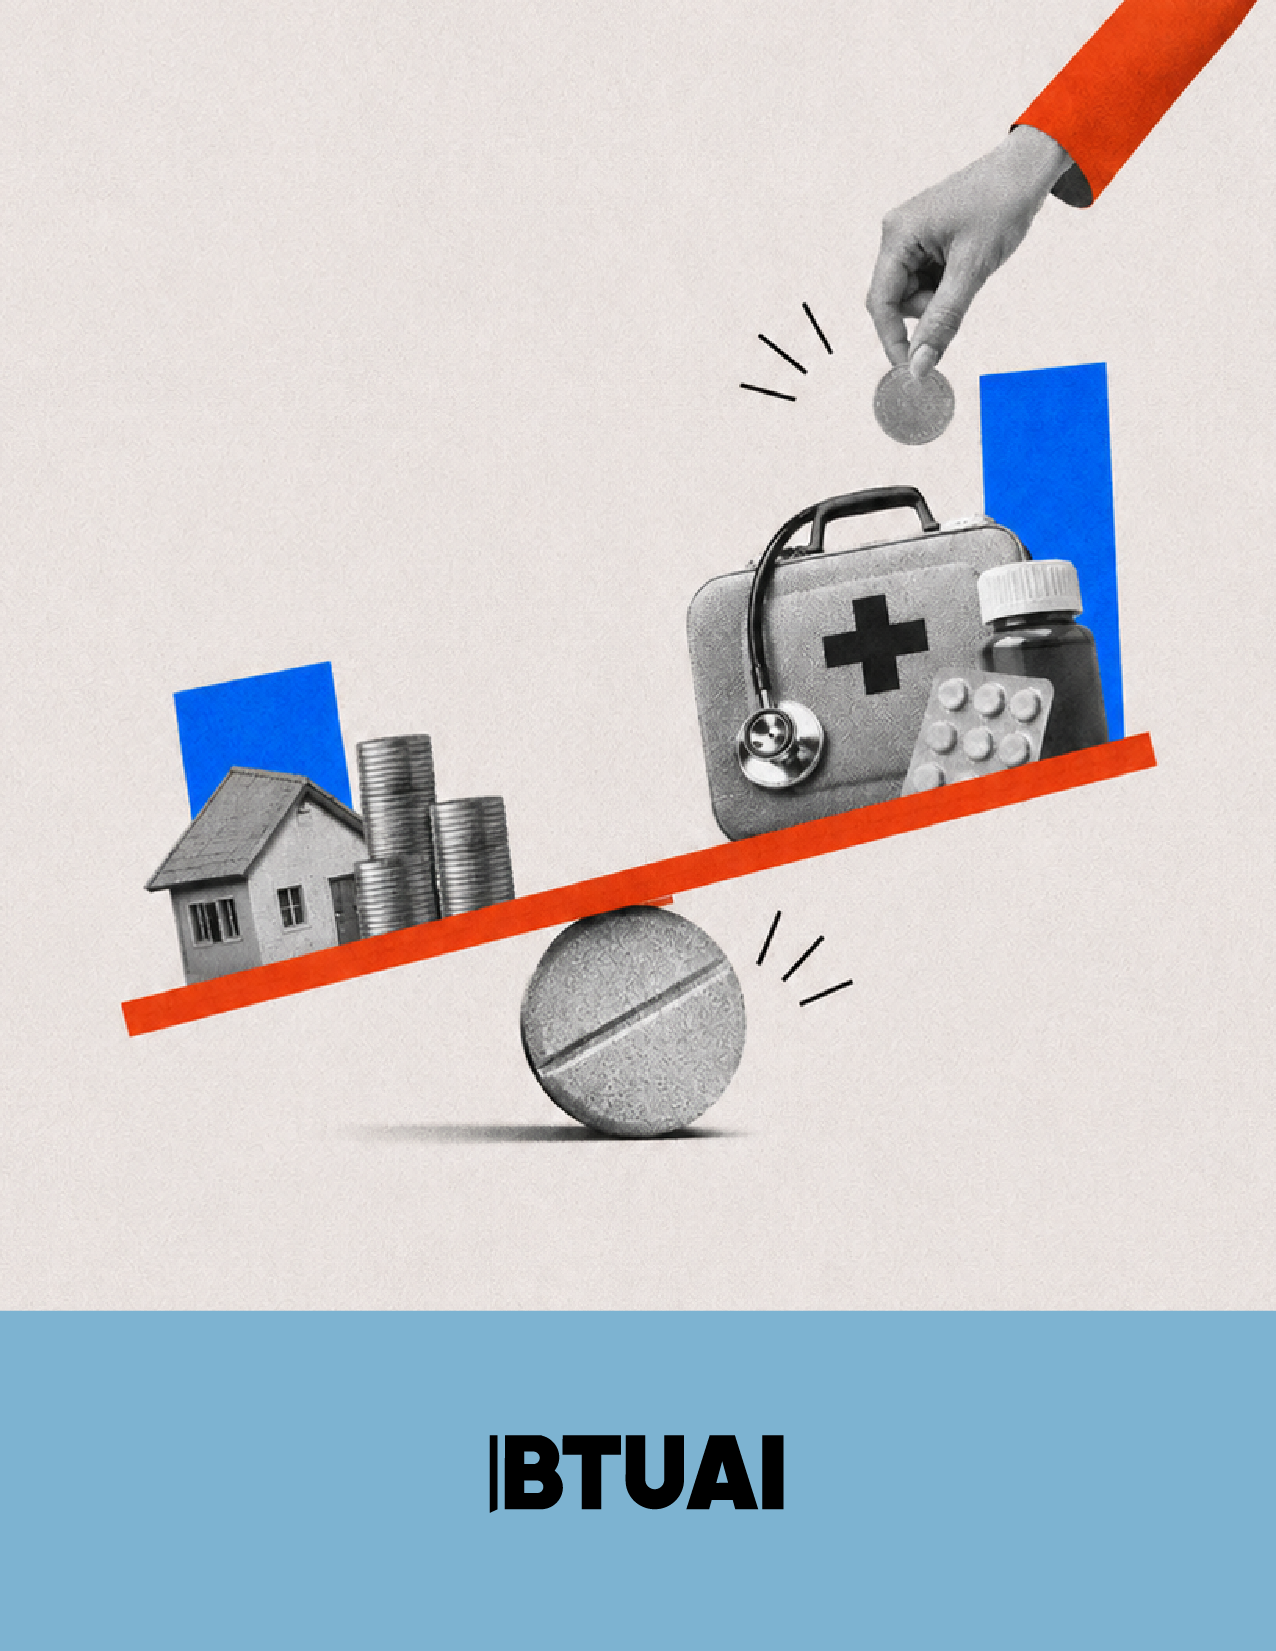
BTU researchers calculate that healthcare accounted for about 11% of Georgian households’ cash consumption expenditure in 2025, while healthcare prices were rising faster than overall inflation in October 2026. Reading these two different measures together shows why access to treatment matters to household finances and business even when healthcare is not the largest contributor to inflation.
Key Takeaways
- Georgia’s healthcare prices rose 8.4% year on year in October 2026, compared with 5.9% for overall consumer prices, according to Geostat. The difference is 2.5 percentage points.
- BTU researchers calculate that average monthly healthcare expenditure of GEL147.95 per Georgian household represented 11.0% of cash consumption expenditure in 2025. This is a historical average, not a patient’s bill in 2026.
- The 11.7% annual increase in outpatient service prices in October 2026 is particularly relevant to Georgian households and employers financing regular medical care. Actual expenditure also depends on service use and coverage terms.
The cost of a medical consultation or diagnostic test has a concrete place in household finances. When necessary care becomes more expensive, a household may have to reduce other expenditure, draw on savings or find additional financing. National inflation is a useful reference, but it cannot fully describe one family’s position. Medical needs, the services purchased and payment arrangements differ considerably.
Geostat’s November 3 release recorded an 8.4% annual increase in the healthcare price group. Overall inflation was 5.9%, leaving a gap of 2.5 percentage points. The comparison is between October 2026 and October 2025, not a measurement of changes already occurring in November. The new evidence provides a specific benchmark for an important household expense.
BTU researchers’ analytical assessment is that healthcare’s place in household expenditure and the rate at which its prices change should be considered together. A price increase matters more when the service already occupies a substantial place in the budget and postponement is difficult. Simply observing that healthcare inflation exceeds the national average does not complete the analysis. The next questions concern the expenditure exposed to that increase and what the available data can establish.
Where healthcare sits in household expenditure
Geostat’s Household Income and Expenditure Survey puts average monthly healthcare expenditure at GEL147.95 per household in 2025. The same table records cash consumption expenditure of GEL1,342.61. Dividing healthcare expenditure by cash consumption gives a share of 11.0%, according to BTU researchers’ calculation. In other words, approximately eleven of every hundred lari of average cash consumption expenditure went on healthcare.
This ratio describes expenditure composition, not the proportion of households that visited a doctor. It is also not the official healthcare weight in the Consumer Price Index. The price index and household survey have different purposes and accounting foundations. Preserving that distinction prevents an expenditure share from one source being inserted automatically into the calculation of another indicator.
Table 1. Average monthly expenditure per household in Georgia in 2025
| Category | GEL |
|---|---|
| Healthcare | 147.95 |
| Housing, water, electricity, gas and other fuels | 151.50 |
| Transport | 153.26 |
| Total cash consumption expenditure | 1,342.61 |
Source: Geostat household expenditure table. Categories are average expenditure amounts. The last row is a total and must not be added to the preceding rows.
The comparison establishes the economic scale of healthcare expenditure. Its average amount was close to both housing and utility expenditure and transport expenditure. These categories serve different needs, but comparing their size explains why higher medical prices should not be treated as a narrow sectoral concern. They can also affect the resources left for other household purchases.
An average conceals substantial variation. One household may have almost no medical payment in a particular month, while another needs several services at once. An average monthly figure drawn from an annual survey does not describe that uneven distribution. GEL147.95 should therefore not be presented as a recommended budget, a necessary minimum or the actual spending of every patient.
Which services are becoming more expensive
The healthcare group combines different goods and services. In the October release, outpatient medical service prices rose 11.7% year on year, while medical products, appliances and equipment rose 9.4%. Outpatient care generally refers to care without an overnight hospital stay. Category names set important boundaries: the broad medical products category does not mean that the price of every medicine changed by the same amount.
Table 2. Annual price changes in Georgia in October 2026
| Indicator | Change from October 2025 |
|---|---|
| Overall consumer prices | 5.9% |
| Healthcare | 8.4% |
| Outpatient medical services | 11.7% |
| Medical products, appliances and equipment | 9.4% |
Source: Geostat inflation release of November 3. The subgroups are components of healthcare; their percentage changes must not be added together.
These differences matter to whoever pays. A household whose medical needs mainly involve consultations and tests should pay attention to the prices of those services. Medicines or equipment may matter more to another household. The overall 8.4% combines different changes and does not establish that every price at a particular clinic or pharmacy rose by exactly that amount.
Healthcare prices increased by 0.4% from the previous month in October. The annual 8.4% and monthly 0.4% describe different periods. Their difference does not by itself prove that price pressure eased in a particular month or that prices began to fall. An annual comparison includes changes accumulated over twelve months and the previous year’s starting point. Assessing the recent direction requires a consistent sequence of monthly observations.
Inflation contribution and the individual bill
According to Geostat, healthcare added 0.69 percentage points to October’s annual inflation. BTU researchers calculate that this represented approximately 11.7% of the overall 5.9% rate. This is healthcare’s contribution relative to the net inflation result, not its share of household expenditure. Some categories became cheaper during the same period, so the final inflation rate combines positive and negative contributions.
Healthcare was not the largest source of the overall increase: transport contributed 2.54 percentage points. However, the macroeconomic ranking and an individual household’s difficulty are different questions. For a household facing substantial necessary treatment expenditure, medical price changes may matter more than healthcare’s contribution to the national basket suggests. A correctly calculated aggregate index does not remove that difference.
Another distinction concerns prices and expenditure. A price index does not directly measure the change in the amount paid. Expenditure can rise because prices increase or because more services are used. It can fall because service use is restricted, coverage changes or medical need declines. Lower household payments do not automatically mean improved access, and a larger bill cannot be attributed entirely to inflation.
Multiplying average healthcare expenditure in 2025 by October 2026’s annual inflation rate would therefore not reliably produce a current “average medical budget.” The first measure is a whole-year expenditure average; the second is a year-on-year price comparison for one month. The quantity and composition of services may also change. This analysis uses historical expenditure to establish scale and current prices to identify pressure. It does not combine them into an artificial forecast.
What changes for business
Healthcare price increases also concern employers when they finance employee insurance or medical assistance. Comparing monthly premiums alone is insufficient when a contract is renewed. The same price can accompany different coverage, copayments or service limits. An economic comparison needs to identify what care the employee receives and what remains payable personally. Inflation data raise these questions but do not establish that any particular insurance product has become more expensive or less comprehensive.
For clinics, a higher price index does not automatically imply higher profit. Revenue depends on patient numbers, the mix of services and agreements with payers; costs depend on staff, materials and other inputs. Those data are needed to assess the specific causes of price increases. The inflation release alone cannot determine how much reflects higher costs, changes in services or a provider’s pricing policy.
How to read the result
BTU researchers’ assessment is that healthcare prices, household expenditure and the care actually received need to be considered together in Georgia. The first already shows growth faster than overall inflation. The second establishes that healthcare occupied a substantial place in household cash consumption. The third is needed to understand how changes affected real access. Service use and payment arrangements connect price statistics to the patient’s circumstances.
October’s figures are neither sufficient grounds for declaring a general crisis nor a reason for reassurance simply because healthcare was not the largest inflation contributor. They identify a concrete economic priority: assessing treatment costs beyond headline inflation. For households, employers and providers, the important question is how much money preserves access to necessary care, and who bears the additional cost.
Questions and answers
What does an 8.4% increase in healthcare prices mean?
It is Geostat’s average annual price change for the healthcare group in October 2026. Individual service prices and individual household expenditure may change differently.
Why is the 11.0% expenditure share different from the 11.7% inflation contribution ratio?
The first describes the composition of cash consumption expenditure in 2025. The second compares healthcare’s official contribution with overall annual inflation in October 2026. The periods and denominators differ.
Can these figures establish a household’s new medical budget?
Not reliably. That requires the quantities of specific services, current prices and coverage terms. A previous year’s average cannot substitute for a current household’s needs.