


Main summary
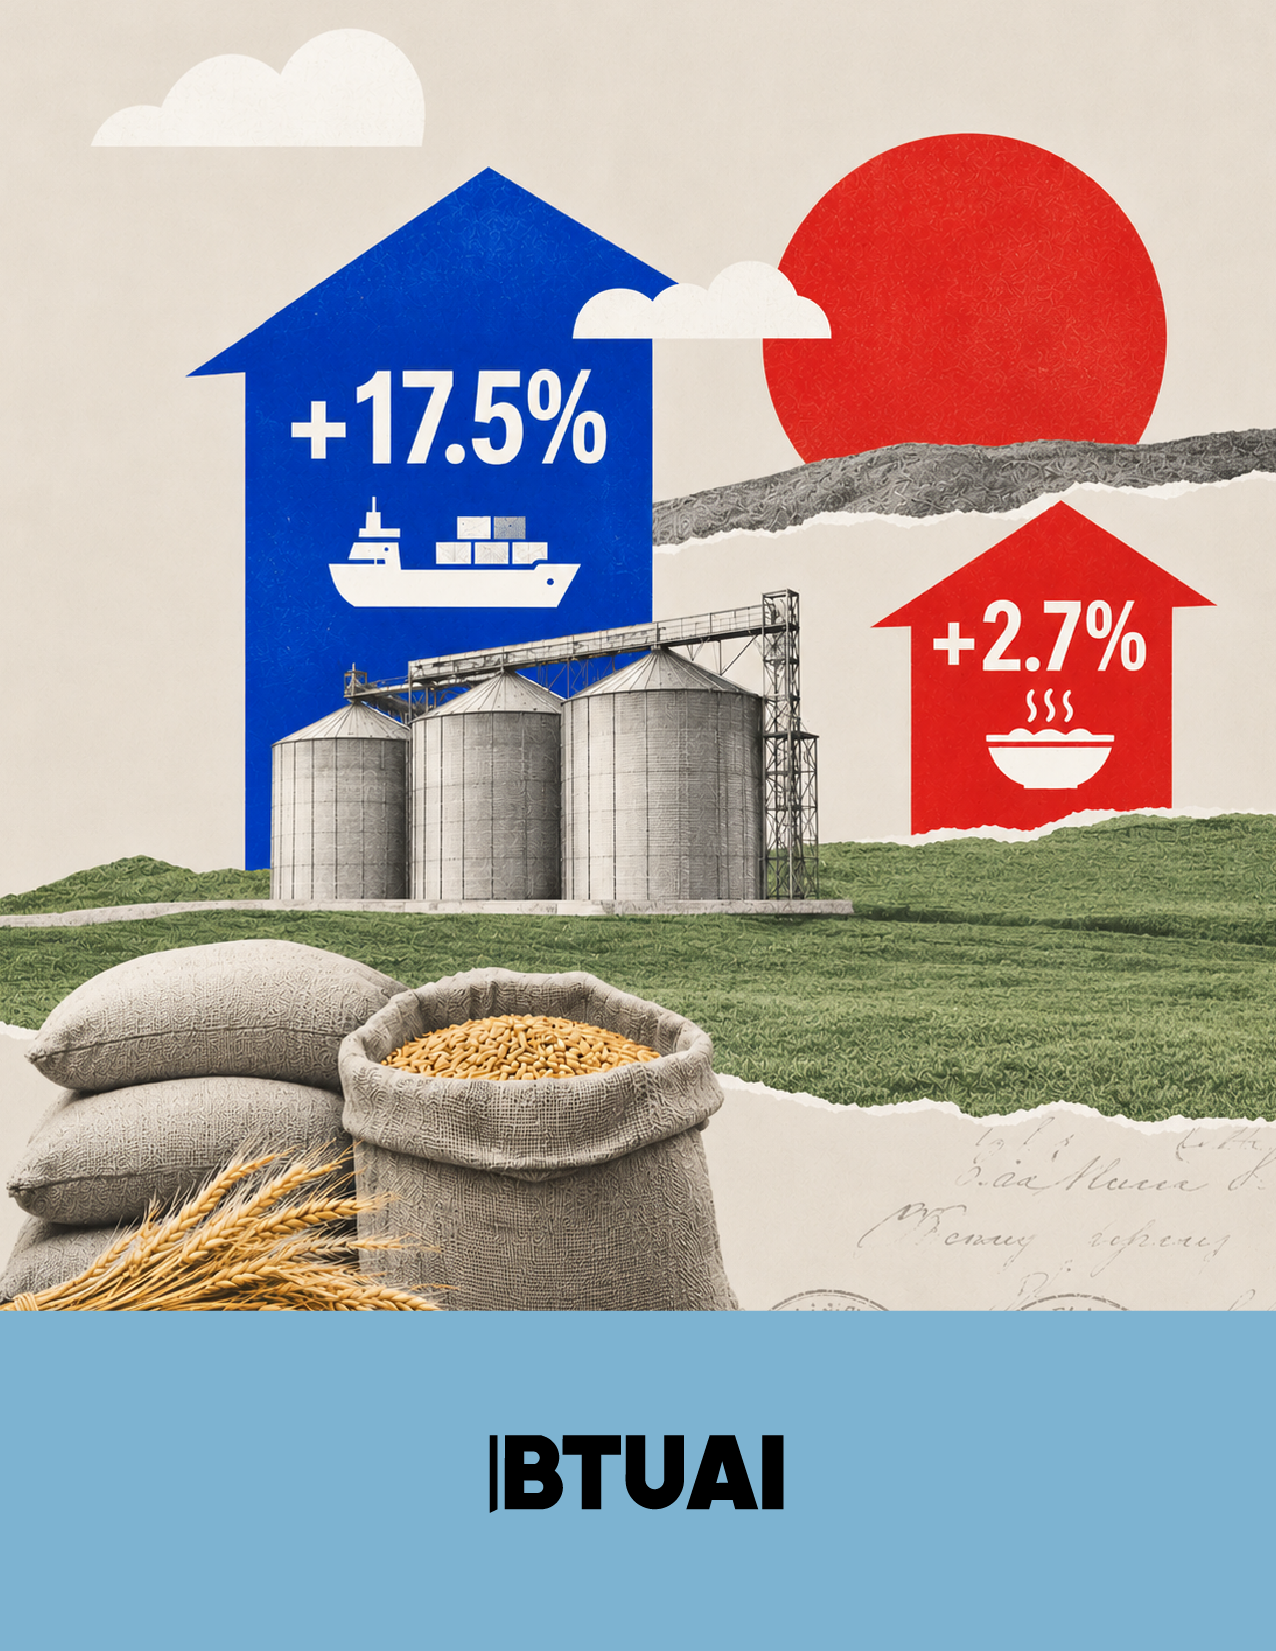
The World Bank’s new October 28 commodity outlook makes food resilience in Georgia a question not just of purchasing prices, but of replenishment and the quality of information about available stocks. BTU’s calculations show that Georgia’s wheat net imports increased by 17.5% in 2025 while food use rose by only 2.7%, alongside a larger positive stock variation; the historical balance does not establish today’s reserve level.
Key Takeaways
- BTU calculates that Georgia’s wheat net imports rose from 543 thousand tonnes in 2024 to 638 thousand tonnes in 2025, while food use increased from 564 to 579 thousand tonnes; the different growth rates require stocks and other uses to be examined separately.
- GeoStat’s 2025 wheat balance reports 19% self-sufficiency and positive stock variation of 146 thousand tonnes; the latter is an annual flow, not Georgia’s October 2026 inventory or a measure of days of supply.
- The World Bank’s October 28, 2026 baseline forecasts a 10% increase in its global food commodity price index in 2026; BTU’s implication for Georgia is to assess usable stocks, replenishment and domestic production together, not apply that percentage to bread prices.
The existence of wheat somewhere in the world does not ensure that the right grain reaches a particular mill when it is needed. Between harvest and delivery lie export capacity, ports, transport, contracts and purchasing finance. When several links become less reliable simultaneously, the international price alone cannot answer whether a food system can absorb disruption. What matters is also how long available supplies can bridge a gap and how replenishment can resume.
The World Bank’s October 28 Commodity Markets Outlook describes such an environment. Its food assessment connects disrupted Black Sea shipments, weather risks and energy and fertilizer costs that can affect future production. The baseline anticipates some easing of constraints next year, but that is an assumption, not an accomplished result. For Georgia, the report’s value therefore extends beyond the direction of its price forecast. It raises distinct questions about buying a commodity, getting it delivered and maintaining availability between deliveries.
Georgia’s historical food balance provides useful but bounded evidence. BTU’s comparison finds wheat import growth far outpacing the increase in food use in 2025. This does not establish a surge in household demand or demonstrate that current reserves are sufficient. It does show why accumulation and subsequent replenishment deserve a central place in the discussion of food resilience.
What the Georgian balance reveals
GeoStat reports wheat imports of 546 thousand tonnes in 2024 and 648 thousand tonnes in 2025. Exports increased from 3 to 10 thousand tonnes. Subtracting exports from imports gives net imports of 543 and 638 thousand tonnes respectively. BTU calculates a rise of 95 thousand tonnes, or 17.5%. Food use increased by just 15 thousand tonnes, or 2.7%, over the same period.
Domestic production meanwhile declined from 149 to 145 thousand tonnes. Positive stock variation increased from 75 to 146 thousand tonnes. The balance also records seed, animal feed, losses and other processing uses. The additional imports cannot therefore be attributed simply to bread consumption. The 71-thousand-tonne increase in positive stock variation is an important part of the difference, although the published rounded balance cannot assign every additional tonne precisely.
| Georgia’s wheat balance | 2024 | 2025 | Meaning |
|---|---|---|---|
| Domestic production, thousand tonnes | 149 | 145 | Physical domestic harvest |
| Net imports, thousand tonnes – BTU calculation | 543 | 638 | Imports minus exports; growth of 17.5% |
| Food use, thousand tonnes | 564 | 579 | Growth of 2.7% in food use |
| Stock variation, thousand tonnes | +75 | +146 | Positive change in stocks during the year |
| Self-sufficiency, % – GeoStat | 22 | 19 | Issuer’s official balance-based indicator |
Source: GeoStat, Agriculture of Georgia 2025, Table 4.1. Products made from wheat are converted to wheat equivalents. Net imports and growth rates are BTU calculations from published rounded data.
The point is not to “discover” stocks: they are a normal component of an annual food balance. The new question is how to use that evidence when an international report identifies simultaneous supply risks. Reading higher imports automatically as higher consumption overlooks accumulation. Treating positive stock variation as a currently available reserve overstates what the data establish.
Stock variation is a flow. It describes a change over a particular year. It does not tell us the opening level, storage locations, ownership, quality, or what happened to stocks in subsequent months. A positive change in 2025 cannot establish the inventory available in October 2026. Nor can it responsibly be converted into days of supply as if the entire quantity were immediately accessible today.
Why the international outlook is also about delivery
The World Bank forecasts a 10% rise in its global food commodity price index in 2026. That is an international commodity forecast, not an estimate of Georgian food or bread inflation. More operationally significant are its assumptions: disruptions to Black Sea shipments persist through the final quarter of 2026 and ease materially in 2027.
The report notes that Russia and Ukraine together account for approximately one-third of global wheat exports. This describes international export concentration, not Georgia’s supplier-country shares. Its importance is that constraints on grain leaving that region can affect alternatives across the world market. Another supplier is useful only when suitable quality, an acceptable price, transport and a workable delivery date can be secured together.
The report also projects a 7% fall in global wheat exports in the 2026-27 crop season. This is a different period from Georgia’s calendar-year 2025 balance and should not be combined into a single growth series. Nevertheless, the expected reduction in export availability makes procurement flexibility more valuable to importing markets. Delivery risks can rise even when a headline about total global production appears reassuring.
A resilience assessment must consequently distinguish two capabilities. One is access to usable product already in the country. The other is the ability to replace it with another shipment. A large purchase can buy time, but that protection does not renew itself if the next contract cannot be financed or transport is delayed. Conversely, a smaller inventory has a different operational meaning when several genuinely reliable replenishment routes exist.
Domestic harvests and inventories are not substitutes
GeoStat’s 19% wheat self-sufficiency indicator reveals a structural dependence on supply from abroad. Its balance-based method compares domestic production with production plus net imports. It is neither the share of Georgian-made bread on shop shelves nor the import component of household spending. Georgian mills and bakeries create local value even when they process imported grain; domestic processing and domestic raw material are different questions.
The World Bank report also identifies a mechanism relevant to domestic production. Higher energy and fertilizer costs are not solely a problem for buyers of imported finished food. Its risk analysis explains that further fertilizer price increases could encourage farmers to reduce application, affecting future yields and supply. This is a potential transmission channel for Georgia, not an effect already measured here. Establishing its actual scale would require local evidence on purchases, application and yields.
Keeping those distinctions improves business decisions. An importer needs to understand usable inventory and finance for the next consignment. A mill needs grain compatible with its production requirements. A farmer needs access to inputs for the next season. Strengthening one link cannot ensure that all the others work. Additional domestic production could reduce dependence, but its value also depends on quality, seasonality and economic viability.
Buffers themselves have costs. Storage requires space, monitoring and finance; capital tied up in grain cannot be used elsewhere. BTU’s conclusion is therefore not an instruction to accumulate without limit or impose an identical reserve on every business. The opportunity is better-informed choice: whether additional flexibility is best purchased through holding stock, arranging alternative supply or securing finance for later procurement.
Resilience begins with what is actually known
The most useful lesson for Georgia is not a guess about the next bread price. It is the need to connect three elements: current use, genuinely accessible stocks and the ability to obtain new supplies. BTU’s comparison demonstrates that confusing these elements conceals a material distinction even in the historical balance. Net import growth did not match food-use growth, while positive stock variation increased.
Public annual statistics provide a foundation, not a current operating picture. Better visibility need not mean publishing an individual company’s commercial terms. Appropriately aggregated information about product quality, availability and replenishment intervals could be useful. This is an analytical recommendation, not a description of an existing public reporting system.
If international constraints ease as the World Bank baseline assumes, flexible procurement can help avoid unnecessarily expensive inventories. If disruptions persist, the same knowledge can help buy time. In either case, the advantage is not one large number. It is understanding what that number represents and what the market can do before the next shipment arrives.
Questions and answers
Does 19% self-sufficiency mean that imports determine 81% of the bread price? No. GeoStat’s indicator describes a physical wheat balance. Bread prices also incorporate processing, other inputs and distribution.
Does the 146-thousand-tonne figure show how much wheat Georgia has today? It is positive stock variation during 2025. Current inventory requires an opening level and subsequent movements as well.
Does the World Bank’s 10% forecast predict the same increase in Georgian food prices? No. It concerns the global food commodity index in 2026, not Georgian retail inflation.
Why assess replenishment as well as stocks? Available product buys time; the restoration of supply supports continuity afterwards. Both depend on actual accessibility rather than annual imports alone.