


Key Takeaway
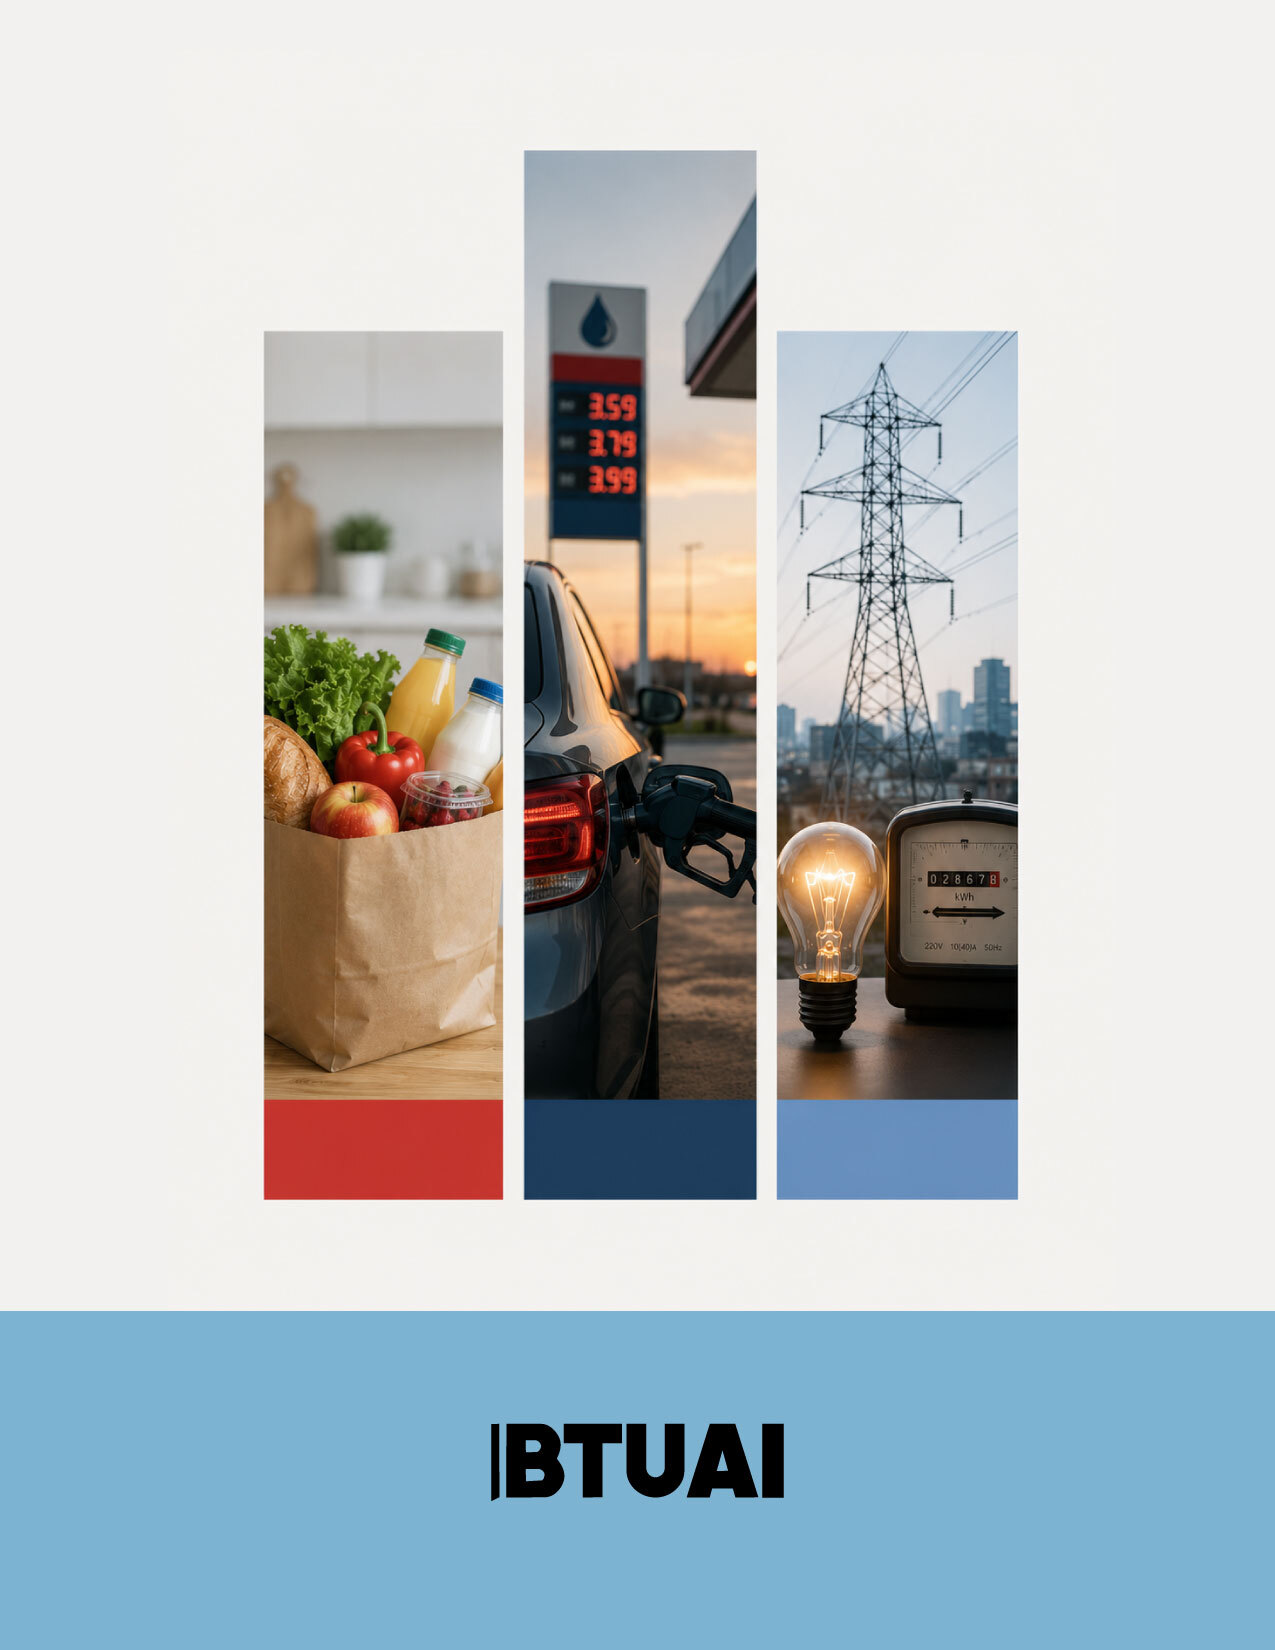
Georgia’s annual inflation rate was 5.8% in June 2026, but the pressure felt by households was concentrated in essentials: food rose by 5.6%, transport by 16.5%, housing and energy costs by 7.2%, and healthcare by 4.7%. BTUAI’s independently verified calculation shows that these four groups generated about 84.1% of headline inflation. In this environment, consumers do more than buy less: they compare more, reduce basket size, switch brands, consolidate trips and postpone larger purchases.
Households Calculate What Will Be Left at the End of the Month
Inflation rarely begins with official statistics for consumers. It begins with a supermarket receipt, a fuel purchase, a utility bill or a pharmacy payment. When several essential costs rise at once, the room for adjustment narrows rapidly.
Food contributed 1.92 percentage points to annual inflation, transport 1.87, housing and energy 0.69, and healthcare 0.40. Together, they accounted for 4.88 percentage points of the 5.8% rate.
Georgia’s consumer confidence index also remained negative in early 2026. It is not a direct measure of June spending, but it confirms a cautious financial environment.
What Changes in the Supermarket
Consumers first adjust within the basket: comparing stores, waiting for promotions, choosing private labels, buying smaller packs or purchasing expensive products less often.
The objective is often not the cheapest option, but a safely affordable one. A low-quality purchase is more costly when the household has less money to correct the mistake. Trust therefore becomes almost as important as price.
Transport Inflation Changes More Than Mobility
The 16.5% increase was the largest among the main groups. Consumers may travel less, combine errands, reduce car use or seek cheaper routes. But higher transport costs also affect delivery, regional supply and service prices.
Customers become more sensitive to delivery charges, making combined orders, minimum-basket thresholds and pickup models more important.
Utilities and Healthcare Reduce Other Spending Before It Happens
Housing, water, electricity, gas and other fuels rose by 7.2%, with electricity, gas and other fuels up 10.1%. Monthly bills reduce the amount available for clothing, furniture, cafés, entertainment and non-essential services.
Healthcare increased by 4.7%, while medical products and equipment rose by 7.5%. Households with recurring medical needs become even more cautious in other categories.
Four Behavioral Responses
Consumers typically search for substitutes, postpone purchases, consolidate orders and seek more information. Reviews, recommendations, guarantees, return conditions and transparent final prices become more influential.
These responses are evidence-based analytical interpretations rather than results from a representative June 2026 survey. Their intensity varies across households.
An Illustrative Georgian Mini-Case
Consider a household that first pays for utilities, transport and recurring medicines. With less money left for food, it buys meat less often, waits for promotions, combines car trips and postpones a phone or furniture purchase.
The reduction is distributed across basket composition, mobility, timing and decision length. Businesses therefore need to track basket size, frequency, substitution and channel changes separately.
What Georgian Businesses Should Notice
Retaining customers requires more than holding prices down. Businesses need to reduce decision risk: clear final prices, credible discounts, simple returns, explained quality and predictable delivery.
Economy versions, smaller packs, basic plans, family bundles, pickup options and personalized loyalty offer become more relevant.
Data analytics can identify falling basket size, brand substitution, regional delivery sensitivity and offers that preserve repeat purchasing. AI can support forecasting and segmentation, but decisions should be validated against real sales and customer feedback.
BTU Researchers’ Assessment
According to BTU researchers, the main consumer effect of June 2026 inflation is broader than increased price sensitivity. Consumers become less tolerant of mistakes: hidden fees, confusing promotions, unreliable cheap products and unstable service. Competitive advantage comes from lowering decision risk as well as price.
Key Findings
- Annual inflation was 5.8% in June 2026, with pressure concentrated in essential categories.
- Food, transport, housing-energy and healthcare generated 4.88 percentage points, or about 84.1% of headline inflation.
- Consumers respond by reducing basket size, switching brands, postponing purchases and consolidating trips.
- Low price alone is insufficient; trust, guarantees, transparent terms and credible discounts become more important.
- Transport inflation affects delivery, e-commerce and regional prices as well as mobility.
- Behavior differs by income, region, household size, health expenses and transport dependence.
- Businesses need to reduce both financial cost and decision risk for customers.
Why This Matters for Georgia
Essential spending occupies a large share of many Georgian household budgets. When these categories rise together, demand weakens in small businesses, services, entertainment, clothing and durable goods.
Policy analysis should therefore look beyond average inflation to essential baskets, regional differences, vulnerable households and actual consumption changes.
Conclusion
When food, transport and utilities become more expensive together, consumers do not simply reduce quantity. They make decisions more slowly, cautiously and collectively.
An inertial business response offers only discounts. A stronger response simplifies choice, creates affordable formats, clarifies final price and uses data to detect behavioral change. During inflation, trust becomes part of the product.
Data and Main Sources
- National Statistics Office of Georgia – Inflation Rate in Georgia, June 2026.
- National Statistics Office of Georgia – official Consumer Price Index data.
- National Bank of Georgia – monetary policy assessment and inflation environment, June 2026.
- ISET Policy Institute – Consumer Confidence Index.
- BTU research and analytical materials – interpretation of likely consumer responses.
This material is analytical and educational in nature. It does not constitute financial, investment, tax or legal advice. Professional advice should be obtained before making a specific decision.
Prepared by the academic team of Business and Technology University and the BTUAI Research Team, Tbilisi, Georgia.