


Over fifteen years the price of a lemon in Georgia rose elevenfold, while a computer lost more than half its value. This report from BTU and BTUAI shows that prices did not simply rise; they split in two, with one half climbing toward the sky and the other half falling. Every month the National Statistics Office (Geostat) tracks more than 305 individual products, and chaining those movements from 2011 to 2026 reveals the divergence: of 306 items, 263 grew dearer while 43 became cheaper, clustering almost entirely in the wardrobe and on the electronics shelf.
What does a single inflation number hide?
When we talk about inflation we name one number, an average for the whole economy, and that average hides the most interesting part. Sort the basket into twelve standard categories and the split is immediate. The typical restaurant meal, school fee and food item has roughly doubled since 2011, the typical phone bill has barely moved, and the typical item of clothing has fallen below where it began. Clothing and footwear is the only category where cheaper items outnumber dearer ones.
Which prices climbed the most?
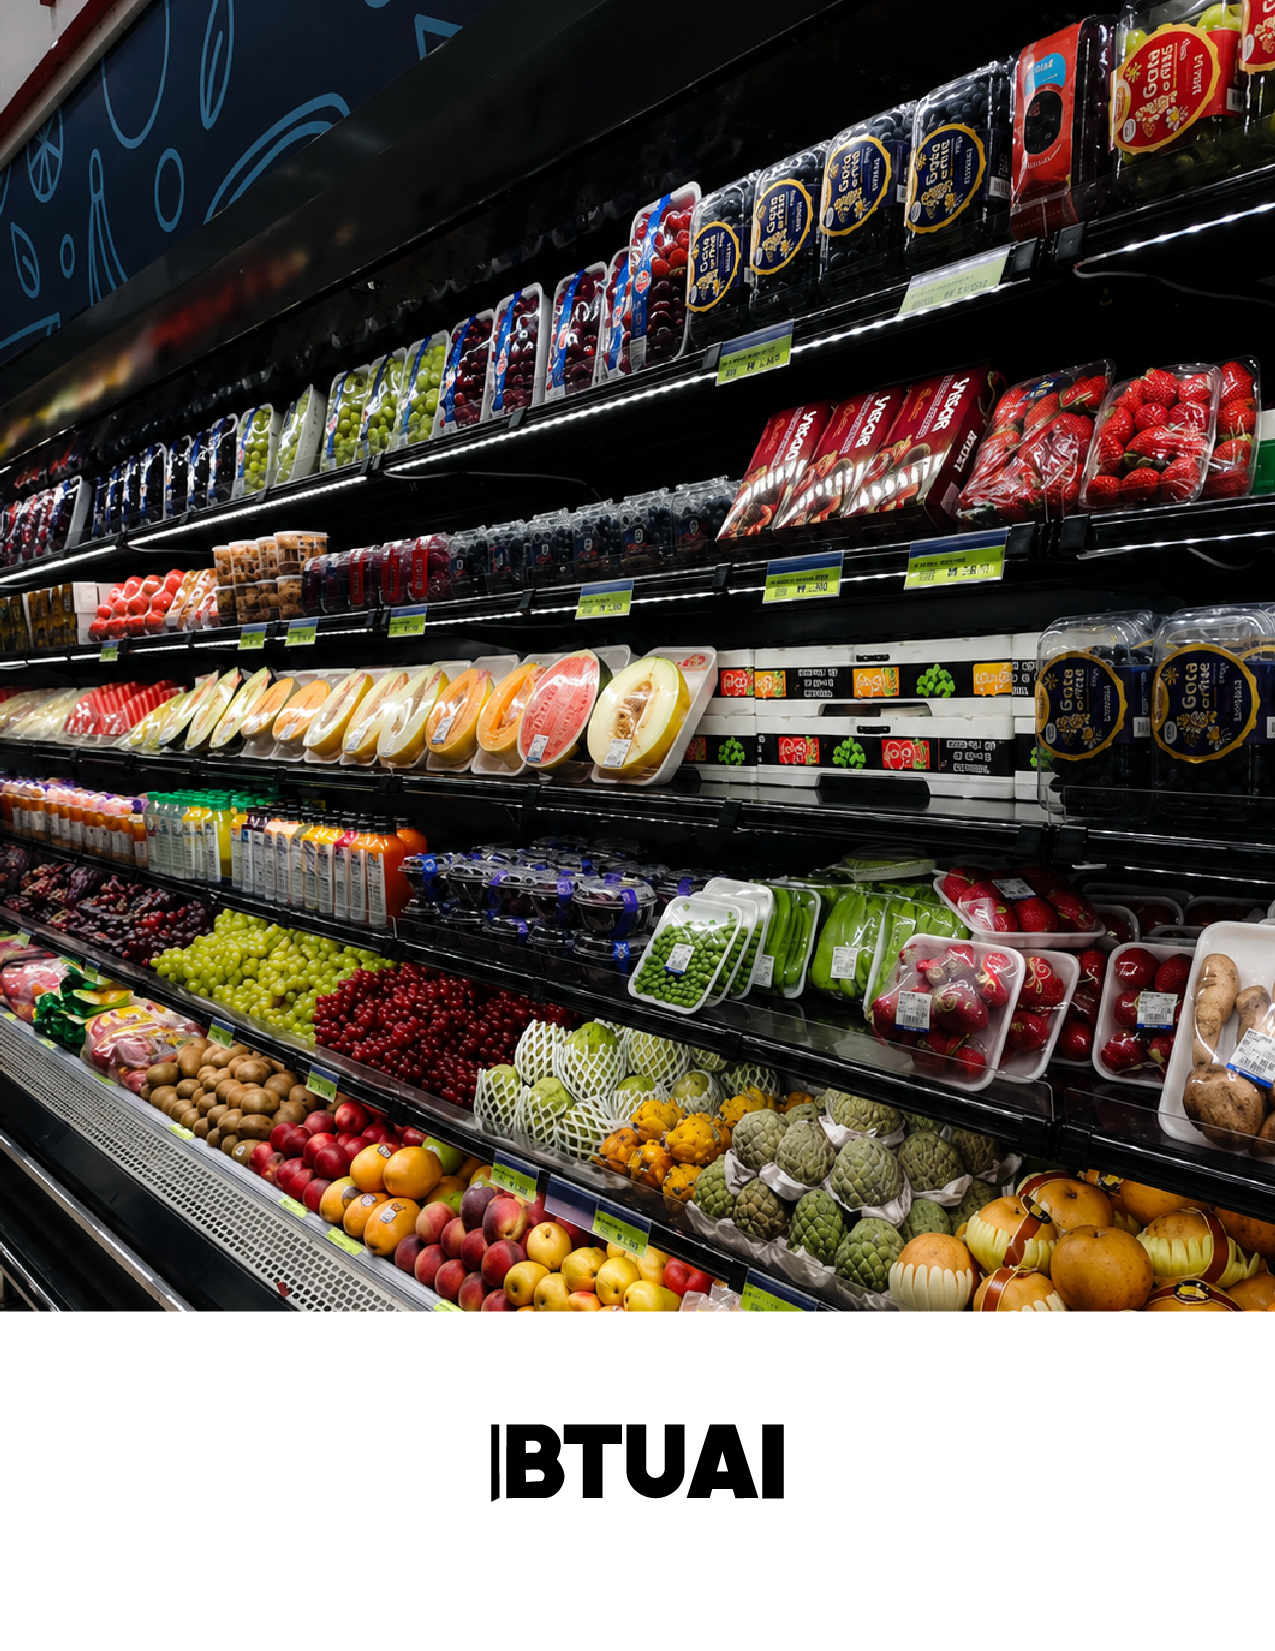
Fresh produce dominates the top of the table. The price of lemons has risen more than tenfold since 2011, standing about 17 times its starting level at the 2025 peak, with plums, pears and cabbage close behind. Not everything at the top is food: imported filter cigarettes have more than quintupled, driven by repeated rises in tobacco excise tax, and a gold wedding ring has more than tripled, tracking the world gold price. A man’s suit is the rare clothing item that rises rather than falls.
And what grew cheaper?
The declines cluster in the wardrobe and the gadget drawer, and they are steep. The biggest faller is the women’s skirt, down by two thirds, with trousers, shirts, sweaters and shoes close behind. Then come the machines: computers fell 59%, televisions and sport shoes dropped sharply, and the monthly home internet bill fell 43% as connections grew faster and cheaper at once. Fresh produce dominates the risers and factory made goods dominate the fallers, so the real story of fifteen years is a split between the field and the factory.
Which prices swing the most?
Cumulative change is only half the picture; the other half is volatility, how violently a price jumps from month to month. Here produce leads again: the most unstable prices in the whole basket belong to watermelon, tomato paste, pickles and potatoes, goods whose price can leap or collapse by a third in a single month.
Was there an inflation wave?
Tracking the typical item month by month brings Georgia’s recent inflation into focus. For most of the 2010s the typical product rose by only one or two percent a year. Then came the post pandemic shock, when supply chains snarled and energy and grain prices spiked after the war in Ukraine, and through 2021 and 2022 the typical product climbed at close to nine percent a year. The wave broke cleanly: by 2023 the rate had returned to the calm of the previous decade and has stayed there since. Prices settled permanently higher, yet they no longer race.
Where are prices heading now?
The latest data, comparing spring 2026 with spring 2025, shows an economy that has largely cooled, though unevenly beneath the surface. The heat has moved out of the supermarket and into services: education and eating out are now among the fastest risers, alongside another round of tobacco and transport increases, while household furnishings are drifting slightly lower.
What does it mean for your wallet?
Strip away the charts and the experience comes down to a few lines on a receipt. Since 2011 a loaf of wheat bread has roughly doubled, eggs have risen about 116%, sugar about 112%, and a tank of petrol nearly 89%. Against all of that, the laptop on the desk costs 59% less than its equivalent did back then, and the home internet carrying these words is 43% cheaper.
So what is the real story?
This is the quiet logic beneath fifteen years of Georgian prices: the things you eat grew dearer, the things you plug in grew cheaper, and the single average inflation number was never the whole truth. The question for the years ahead is whether services such as education, restaurants and health care can keep the heat while the price of goods stays under the pressure of global competition.
This analysis was prepared by the academic team of the Business and Technology University (BTU), together with BTUAI, in Tbilisi, Georgia. It draws on Geostat’s detailed price indices and other public sources and is analytical in nature. The full report, with category tables and the fifteen year receipt of everyday goods, is attached as a PDF.
Keywords: consumer prices Georgia, inflation Georgia, Geostat consumer price index, cost of living Tbilisi, food prices, clothing prices, electronics prices, price divergence, CPI 2011 2026, household budget.
Citation: Business and Technology University (BTU) & BTUAI. (2026). 15 Years of Consumer Prices in Georgia. Tbilisi, Georgia.